Web Development
Core Web Vitals help website owners understand how real users experience page loading, responsiveness, and visual stability.
A website may look attractive and contain useful content. However, users can still have a poor experience when the main content loads slowly, buttons respond late, or page elements move unexpectedly.
Therefore, improving these performance signals can make a website faster, easier to use, and more reliable across mobile phones, laptops, networks, and locations.
What Are Core Web Vitals?
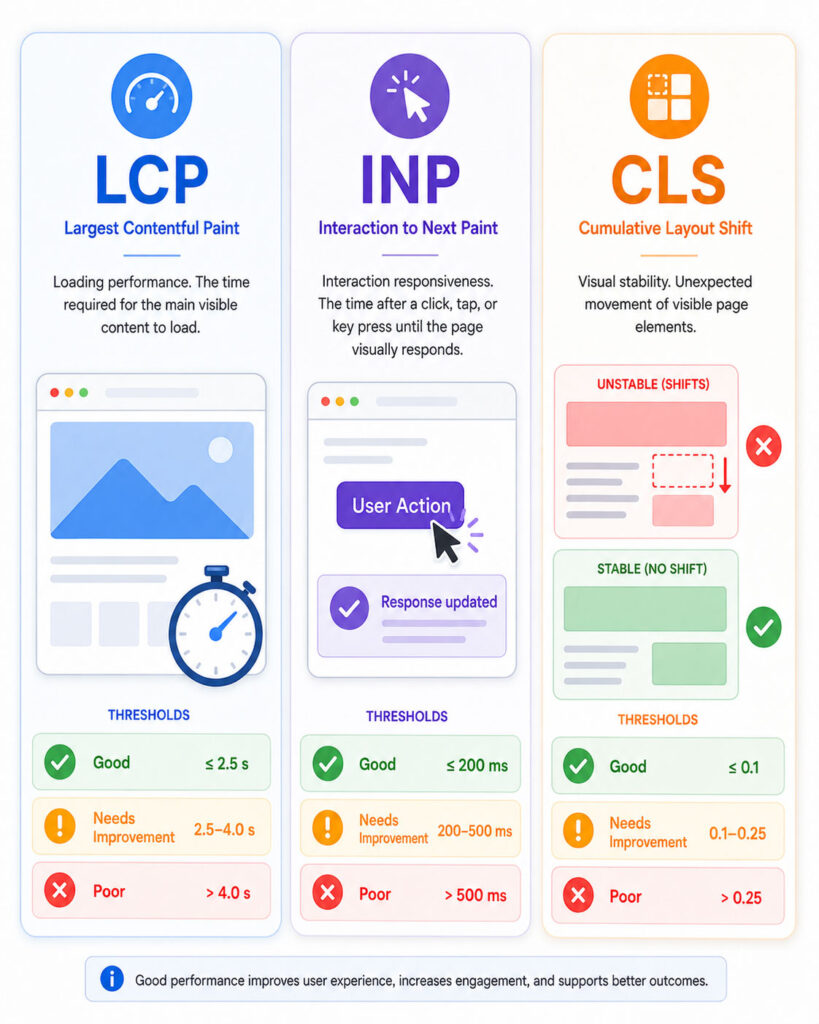
Core Web Vitals are a set of user-experience metrics created by Google.
The current set focuses on three important areas:
- Largest Contentful Paint: Measures loading performance.
- Interaction to Next Paint: Measures responsiveness.
- Cumulative Layout Shift: Measures visual stability.
Together, these metrics describe whether users can see meaningful content quickly, interact without frustrating delays, and browse without unexpected layout movement.
Current Core Web Vitals Metrics
| Metric | Measures | Good | Needs Improvement | Poor |
|---|---|---|---|---|
| LCP | Loading performance | 2.5 seconds or less | Above 2.5 and up to 4 seconds | Above 4 seconds |
| INP | Interaction responsiveness | 200 milliseconds or less | Above 200 and up to 500 milliseconds | Above 500 milliseconds |
| CLS | Visual stability | 0.1 or less | Above 0.1 and up to 0.25 | Above 0.25 |
Google evaluates these values at the 75th percentile of page visits. In simple terms, the page should provide a good experience for at least 75% of measured visits.
To pass the overall assessment, the page or origin must achieve a good result for all three available metrics.
What Is Largest Contentful Paint?
Largest Contentful Paint, or LCP, measures how long the largest visible content element takes to appear within the initial viewport.
The LCP element may be:
- A large hero image.
- A featured blog image.
- A heading or large block of text.
- A banner background image.
- A video poster image.
For example, suppose a page displays its navigation quickly but keeps the main hero image blank for several seconds. Users may still feel that the page loads slowly because the most important visible content has not appeared.
Therefore, a good LCP result requires more than displaying a header or loading indicator quickly.
Common Causes of Poor LCP
- Slow server response time.
- Large and uncompressed hero images.
- Images that the browser discovers too late.
- Render-blocking CSS or JavaScript.
- Web fonts that delay visible text.
- Client-side rendering that waits for JavaScript.
- Too many redirects before the page loads.
- Slow third-party services.
Because several stages affect loading, improving only the image size may not fully solve the issue.
What Is Interaction to Next Paint?
Interaction to Next Paint, or INP, measures how quickly a page gives visual feedback after user interactions.
It observes interactions such as:
- Mouse clicks.
- Screen taps.
- Keyboard input.
For instance, a user may tap a mobile menu button. If the browser remains busy and the menu appears late, the interaction contributes to a poor responsiveness experience.
INP considers interactions throughout the page visit rather than measuring only the first interaction. As a result, it provides a broader view of how consistently the website responds.
Common Causes of Poor INP
- Long JavaScript tasks on the main thread.
- Large scripts that execute before responding to input.
- Complex event handlers.
- Large or frequently changing page layouts.
- Slow rendering after an interaction.
- Heavy third-party scripts.
- Excessive DOM size.
- Unnecessary work triggered by every click or keystroke.
Therefore, improving INP usually requires reducing the work that happens before the browser can display the next frame.
What Is Cumulative Layout Shift?
Cumulative Layout Shift, or CLS, measures unexpected movement of visible page content.
A layout shift may happen when:
- An image loads without reserved space.
- An advertisement appears above existing content.
- A web font changes the size of the text.
- A banner or popup enters the layout unexpectedly.
- Lazy-loaded content pushes other elements downward.
- A button moves just before the user clicks it.
Unlike LCP and INP, CLS does not use seconds or milliseconds. Instead, it produces a score based on how much visible content moves and how far it moves.
Consequently, a lower score represents a more stable page.
Why Visual Stability Matters
Unexpected movement can interrupt reading and cause incorrect clicks.
For example, a user may try to select a navigation link. However, an advertisement may load above it and move the page at the last moment. The user may then click the wrong element.
Therefore, visual stability affects usability, trust, accessibility, and conversion-related actions.
Core Web Vitals and User Experience
These metrics focus on practical experiences rather than technical speed alone.
| User Question | Related Metric |
|---|---|
| Can I see the main content quickly? | LCP |
| Does the page respond quickly when I interact? | INP |
| Does the page remain visually stable? | CLS |
A website can perform well in one area and poorly in another. Therefore, teams should review all three metrics instead of focusing only on a general performance score.
Field Data vs Lab Data
Website performance tools commonly provide field data, lab data, or both.
| Data Type | Meaning | Best Use |
|---|---|---|
| Field Data | Measurements collected from real users across actual devices and networks | Understanding real user experience |
| Lab Data | Measurements collected in a controlled and simulated environment | Finding and debugging technical problems |
Field results can vary because visitors use different phones, computers, browsers, networks, and locations.
Meanwhile, lab tests use fixed conditions to make repeated testing easier. However, one simulated test cannot represent every real user.
Therefore, use field data to identify actual experience problems and lab data to investigate their likely causes.
How to Measure Core Web Vitals
Start by measuring the website before making changes.
Otherwise, you may spend time optimising an element that does not cause the real problem.
Several Google tools can help with measurement and diagnosis.
Use PageSpeed Insights
PageSpeed Insights tests individual URLs on mobile and desktop.
When enough real-user information exists, the report displays field data from the Chrome User Experience Report. It also runs a Lighthouse lab test and provides technical recommendations.
Review the report in two stages:
- Check whether real users pass LCP, INP, and CLS.
- Use the lab diagnostics to investigate likely causes.
PageSpeed Insights field data covers a rolling 28-day period. Therefore, changes may not appear immediately in the real-user section.
Use Google Search Console
The Core Web Vitals report in Search Console provides a broader view of website performance.
It can help identify groups of URLs that show similar mobile or desktop problems. As a result, website owners can find templates or components that affect many pages.
For example, poor LCP across several blog pages may point to the common hero-image template rather than one individual article.
Use Chrome DevTools
Chrome DevTools can help developers record page loading, interactions, layout shifts, network requests, and main-thread work.
The Performance panel is especially useful for investigating:
- Long JavaScript tasks.
- Slow user interactions.
- Layout-shift events.
- Render-blocking resources.
- Heavy scripting and rendering activity.
In addition, the Network panel can show large files, slow requests, caching behaviour, and resource-loading order.
Use Real User Monitoring
Real User Monitoring collects performance information from visitors who use the website.
Unlike general public datasets, a custom monitoring setup can include page type, device category, application version, interaction name, or other useful context.
Therefore, larger websites can use this information to identify exactly which pages, devices, or user actions produce poor results.
How to Improve LCP
Improving LCP requires reducing the time before the browser displays the largest visible element.
First, identify the actual LCP element. Then, review every stage that delays it.
1. Improve Server Response Time
The browser cannot display page content before the server starts responding.
Therefore, reduce unnecessary backend work and review:
- Hosting performance.
- Database queries.
- Server-side caching.
- Application processing.
- Redirect chains.
- Content delivery network configuration.
- External API calls required before rendering.
For dynamic websites, page caching can reduce repeated server processing. However, teams should exclude personalised or sensitive responses when required.
2. Optimise the Main Image
A large hero or featured image often becomes the LCP element.
Use an appropriately sized image rather than serving the original camera or design file. In addition, compress the image and choose an efficient supported format.
Responsive image markup can also help the browser select a suitable file for the visitor’s screen.
3. Do Not Lazy Load the LCP Image
Lazy loading helps with images that appear farther down the page.
However, lazy loading the main above-the-fold image can delay its discovery and download. Therefore, the likely LCP image should load immediately.
The browser can also receive a high-priority hint when the image is important:
<img
  src="blog-hero.webp"
  width="1600"
  height="900"
  fetchpriority="high"
  alt="Website performance dashboard"
>
The width and height attributes also help reserve the correct layout space.
4. Make the LCP Resource Easy to Discover
The browser should find the main image or font early in the HTML response.
If JavaScript adds the hero image after the page starts, the download may begin late. Similarly, CSS background images may require the browser to download and process a stylesheet before discovering the asset.
Therefore, place critical visual resources directly in the initial markup when practical.
5. Reduce Render-Blocking Resources
Large stylesheets and synchronous scripts can delay visible content.
Remove unused CSS, reduce unnecessary JavaScript, and load non-critical scripts after important content.
However, avoid deferring styles that the first visible screen requires. Otherwise, users may briefly see an unstyled page.
6. Optimise Web Fonts
Fonts can delay text rendering or cause layout changes.
Use only the required font families and weights. In addition, preload a critical local font only when the page genuinely needs it immediately.
A suitable font-display strategy can allow fallback text to appear while the custom font loads.
7. Use Server Rendering or Pre-Rendering When Suitable
Client-rendered applications may show limited content until JavaScript downloads and executes.
Server rendering or pre-rendering can deliver useful HTML earlier. As a result, users and search engines can receive meaningful content before the complete client application becomes interactive.
Nevertheless, teams should measure the final result because server rendering does not automatically guarantee good performance.
How to Improve INP
Improving INP requires reducing the delay between an interaction and the next visible update.
The complete interaction includes input delay, event-handler processing, rendering, and painting.
1. Reduce Long JavaScript Tasks
A long task can block the browser from responding to clicks, taps, and keyboard input.
Break large tasks into smaller units so the browser can process important user-facing work between them.
In addition, remove code that does not need to run during the interaction.
2. Load Less JavaScript
Large JavaScript bundles require downloading, parsing, compiling, and execution.
Use code splitting and load features only when users need them. Also, remove unused libraries, duplicate packages, and unnecessary compatibility code.
Consequently, the browser can spend more time responding to the user and less time processing unused scripts.
3. Simplify Event Handlers
Click and input handlers should perform only the work required for immediate feedback.
For example, show the updated interface first. Afterwards, complete lower-priority analytics, logging, or background calculations.
Avoid running expensive loops, large DOM searches, or synchronous network-related work inside the handler.
4. Reduce Layout and Rendering Work
Complex pages can require significant work whenever JavaScript changes the interface.
Therefore, avoid changing many elements individually when one structured update can achieve the same result.
Large DOM trees, repeated style calculations, and forced synchronous layouts can all delay the next visual frame.
5. Optimise Third-Party Scripts
Advertising, analytics, chat, maps, social widgets, and tracking tools can add main-thread work.
Review whether every third-party script provides enough value. Then, delay non-essential tools until after the main content or user consent when appropriate.
Most importantly, do not install several plugins or tags that provide overlapping functionality.
6. Use Web Workers for Heavy Calculations
A Web Worker can move suitable JavaScript calculations away from the main browser thread.
This approach can help with data processing, parsing, or other CPU-intensive tasks that do not require direct DOM access.
However, communication between the page and worker also has a cost. Therefore, measure whether the change improves the real interaction.
How to Improve CLS
Improving CLS requires reserving space before content appears.
1. Add Image Dimensions
Always provide dimensions for images and videos when possible.
<img
  src="article-image.webp"
  width="1200"
  height="675"
  alt="Core Web Vitals performance report"
>
The browser can use these dimensions to calculate the aspect ratio and reserve space before the image finishes loading.
2. Reserve Space for Responsive Media
CSS can keep the reserved area responsive:
.blog-image {
  width: 100%;
  height: auto;
  aspect-ratio: 16 / 9;
}
However, the declared ratio should match the real media ratio. Otherwise, the page may still shift when the file loads.
3. Reserve Space for Ads and Embeds
Advertisements, videos, maps, and social embeds can arrive after the surrounding content.
Therefore, place them inside containers with an expected minimum height or aspect ratio.
When an advertisement sometimes remains empty, preserve the reserved area or collapse it without moving visible content unexpectedly.
4. Avoid Inserting Content Above Existing Content
Cookie notices, promotional banners, validation messages, and application alerts can push the whole page downward.
Whenever practical, reserve their space from the beginning or display them as overlays that do not change the document layout.
However, overlays must remain accessible and should not obstruct important content.
5. Control Font-Related Shifts
A fallback font and a web font may use different character sizes.
Consequently, text can change width or height when the custom font arrives.
Reduce this effect by using suitable fallback fonts, loading only necessary font files, and applying font-metric adjustments when required.
6. Animate with Transform and Opacity
Animations that change layout properties can move surrounding content.
Instead, prefer transform and opacity for visual movement when appropriate. These properties usually avoid recalculating the complete page layout.
Core Web Vitals for WordPress
WordPress performance depends on the theme, plugins, hosting, images, fonts, page builder, database, and third-party services.
Therefore, avoid installing a performance plugin and assuming that it will solve every issue automatically.
First, measure the website. Next, identify the actual bottleneck. Finally, apply one controlled change at a time.
1. Review the WordPress Theme
A theme controls much of the website’s HTML, CSS, JavaScript, templates, and responsive behaviour.
A visually rich theme may load sliders, animations, icon libraries, and scripts that the current page does not need.
Therefore, disable unused theme features where possible. Also, keep the theme and child theme updated after testing changes safely.
2. Audit WordPress Plugins
Each plugin can add scripts, styles, database queries, background tasks, or remote requests.
Remove plugins that no longer provide useful functionality. In addition, avoid keeping several plugins for caching, analytics, social sharing, popups, or image optimisation when one reliable solution is enough.
Before removing a plugin, confirm whether the website depends on its shortcodes, widgets, database tables, or generated content.
3. Configure Page Caching
Page caching can reduce the time WordPress spends building the same public page repeatedly.
However, caching must respect logged-in users, shopping carts, forms, personalised content, and other dynamic features.
After changing the configuration, clear the relevant cache layers and test both public and authenticated pages.
4. Optimise WordPress Images
Upload images at sensible dimensions and compress them before or during the upload process.
In addition, confirm that WordPress generates and uses suitable responsive image sizes.
Lazy load images below the first visible screen. However, exclude the main hero or featured image when it becomes the LCP element.
5. Review Page Builder Output
Page builders can simplify design work, but deeply nested sections may create a large DOM and additional CSS or JavaScript.
Therefore, remove unnecessary wrappers, hidden widgets, duplicate mobile sections, and unused animations.
Also, avoid loading a complete widget library when the page uses only a few simple elements.
6. Optimise Fonts and Icons
Loading many font families, weights, and icon libraries increases network and rendering work.
Use only the styles required by the design. Furthermore, consider local font hosting when it fits the licensing and technical requirements.
For simple icons, inline SVG or a small icon set may require fewer resources than a large font library.
7. Review Database and Backend Performance
Slow database queries and excessive background work can delay the initial response.
Clean expired temporary records through trusted processes, optimise recurring queries, and review autoloaded settings carefully.
However, create a database backup before changing tables or deleting records.
8. Use a Content Delivery Network When Useful
A content delivery network can serve static resources from locations closer to visitors.
This approach may reduce network delay for images, stylesheets, JavaScript, and fonts.
Nevertheless, incorrect cache rules or duplicated optimisation layers can create problems. Therefore, verify the configuration after activation.
Improve Mobile Performance First
Mobile visitors may use slower devices and less reliable networks than desktop visitors.
As a result, a page that feels fast on a high-end computer may respond slowly on an average phone.
Test important pages on real mobile devices when possible. Also, review:
- Mobile menus.
- Sticky headers.
- Popups and cookie notices.
- Touch interactions.
- Responsive images.
- Mobile-only scripts and widgets.
- Content movement during scrolling.
Most importantly, do not hide heavy desktop components with CSS while still downloading and running them on mobile.
Prioritise Important Page Types
Large websites may contain hundreds or thousands of URLs.
Instead of optimising every page individually, begin with templates that receive significant traffic or support important user actions.
| Page Type | Common Priority |
|---|---|
| Home page | Brand discovery and navigation |
| Blog listing | Content discovery and repeated cards |
| Blog details | Reading experience and featured images |
| Service pages | Lead generation and business information |
| Contact page | Forms, maps, and conversion actions |
| Product or checkout pages | Revenue-related interactions |
Once you fix a shared template, many URLs may improve together.
Core Web Vitals and SEO
Google uses these performance signals within its ranking systems and recommends good results for Search and overall user experience.
However, passing the assessment does not guarantee high rankings.
Search visibility also depends on useful content, relevance, crawlability, indexing, links, page structure, mobile usability, and many other factors.
Therefore, treat website performance as one part of a complete user-focused SEO strategy.
Do Not Chase a Perfect Lighthouse Score
A high Lighthouse score can show that a controlled test performs well.
However, real users may still experience problems across slower devices, different networks, long visits, and later interactions.
Consequently, prioritise good field results and practical user improvements rather than changing useful features only to reach a perfect lab score.
Why Lab and Field Results May Differ
Lab results come from one simulated test, while field results represent many real visits.
Differences can appear because of:
- Device performance.
- Network speed.
- User location.
- Cache state.
- Logged-in or personalised content.
- Consent and third-party scripts.
- Interactions that happen after page load.
- Changes introduced during the 28-day collection period.
For example, a lab test may not interact with a menu or form. Therefore, it may not reveal the same INP problem that real users experience.
Similarly, a short page-load test may miss layout shifts that happen after scrolling.
Common Core Web Vitals Mistakes
- Optimising only the home page.
- Checking desktop performance but ignoring mobile.
- Using only one Lighthouse run.
- Lazy loading the main above-the-fold image.
- Removing useful functionality without measuring the benefit.
- Installing several overlapping optimisation plugins.
- Ignoring third-party scripts.
- Failing to reserve space for media and ads.
- Assuming a green score guarantees higher rankings.
- Expecting field data to update immediately.
A measured and repeatable process prevents these mistakes.
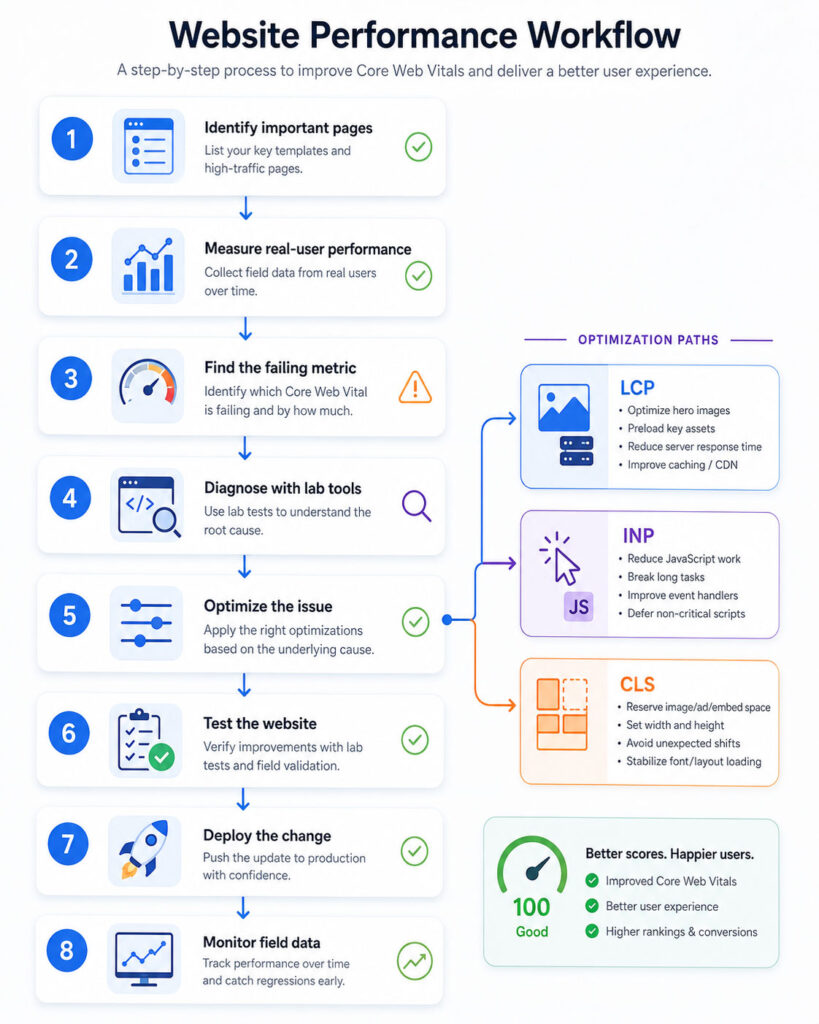
Recommended Website Performance Workflow
- List the website’s most important page types.
- Check field data in PageSpeed Insights and Search Console.
- Identify whether LCP, INP, CLS, or several metrics need work.
- Use lab tools to reproduce and diagnose the problem.
- Find the specific image, script, style, interaction, or layout shift involved.
- Apply one controlled change.
- Test for visual, functional, and accessibility problems.
- Compare the lab result before and after the update.
- Deploy the verified improvement.
- Monitor real-user data over the following weeks.
This workflow links every technical change to a measured problem.
Core Web Vitals Improvement Checklist
| Area | Recommended Check |
|---|---|
| LCP | Identify and prioritise the main visible content |
| Images | Resize, compress, and load responsive files |
| Server | Reduce response time and use safe caching |
| JavaScript | Remove unused code and split long tasks |
| Interactions | Keep event handlers small and responsive |
| Layout | Reserve space for images, embeds, ads, and banners |
| Fonts | Load only required families and weights |
| Third Parties | Remove, delay, or limit non-essential scripts |
| Mobile | Test real devices and slower conditions |
| Monitoring | Review field data after deployment |
How Long Does It Take to See Improvement?
Lab tools can show the effect immediately after the new version becomes publicly available and caches update.
However, CrUX-based field reports use a rolling 28-day collection period. Therefore, the reported values may improve gradually as new visits replace older data.
Search Console may also require time to collect and process enough user information.
Final Verdict
Core Web Vitals provide a practical way to evaluate loading, responsiveness, and visual stability.
A good website displays its main content quickly, responds promptly to user input, and keeps page elements stable.
Therefore, begin with real-user data, investigate the exact cause, and apply focused changes instead of relying on general optimisation promises.
Conclusion
Core Web Vitals consist of LCP, INP, and CLS.
Improve LCP by prioritising important content and reducing loading delays. Next, improve INP by reducing main-thread work and simplifying interactions. Finally, improve CLS by reserving space and preventing unexpected movement.
Most importantly, measure performance continuously. Websites, plugins, content, scripts, and visitor behaviour change over time, so performance work should remain an ongoing part of website maintenance.